TIG: Telegraf InfluxDB Grafana Monitoring
I've set up the open source TIG stack to monitor the services running on these servers. TIG = Telegraf + InfluxDB + Grafana.
-
Telegraf is a server agent for collecting and reporting metrics. It comes with a large number of input, processing and output plugins. Telegraf has built-in support for Docker.
-
InfluxDB is a time series database.
-
Grafana is a feature-rich metrics dashboard supporting a variety of backends including InfluxDB.
Each of the above runs in a Docker container. Architecturally, Telegraf stores the metrics data that it collects into InfluxDB. Grafana generates visualizations from the data that it reads from InfluxDB.
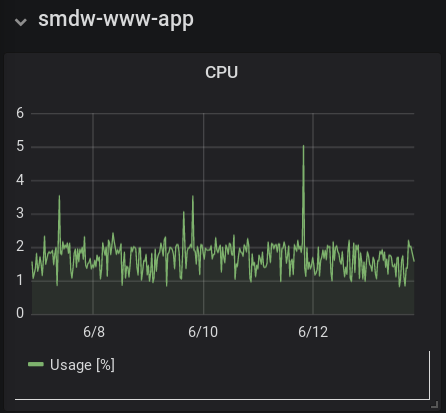
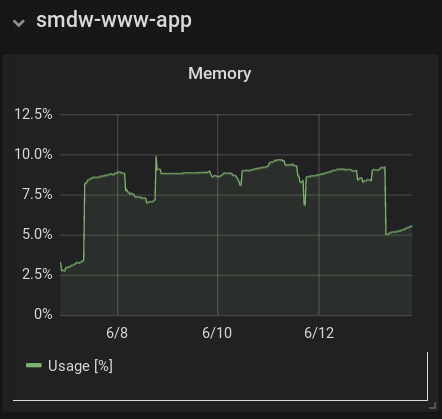
Here are the CPU and memory visualizations for this blog, running on Pharo 7 within a Docker container. The data is as collected by Telegraf via querying the host's Docker engine.


Following comes to mind:
-
While Pharo is running on the server, historically I've kept its GUI running via RFBServer. I haven't had to VNC in for a long time now though. Running Pharo in true headless mode may reduce Pharo's CPU usage.
-
In terms of memory, ~10% usage by a single application is a lot on a small server. Currently this blog stores everything in memory once loaded/rendered. But with the blog's low volume, there really isn't a need to cache; all items can be read from disk and rendered on demand.
Only one way to find out - modify software, collect data, review.
Tags: DevOps, Docker